

-
Products
- Local Securities
- China Connect
- Grade Based MarginNEW
- Stock Borrowing & Lending
- IPO
- Stock Options
- Foreign Stocks
- Unit Trust
- Local Futures
- Foreign Futures
- Forex
- Bullion
- Insurance Services
- Bond
- Monthly Investment Plan
- Mortgage
- Other Services
- Surplus Cash Facility
- Phillip Premier
- Latest Insurance Promotion<
- ETF
- Capital Management
- Research
- Market Info
- Education Center
- Phillip Apps
- Customer Service
- About Us
-
Surplus Cash Facility
-

- Phillip Apps
- MetaStock®
- Features
Features
MetaStock® provides wide range of analysis tools including well-known indicators, simulation system testers and Forecaster. MetaStock® can also be used to develop filters and conditions according to your own preferences to explore investment opportunities.
There are over hundred build-in indicators you can use in MetaStock®, some famous indicators such as: Moving Average (SMA,EMA,WMA), MACD, Relative Strength Index, Directional Movement Index, Bollinger Bands, Stochastics, On Balance Volume, Parabolic SAR, Williams'%R, TRIX, CCI, Money Flow Index, Chaikin Money Flow, Ultimate Oscillator, Swing Index, Volatility, etc.
In each indicators, MetaStock® also allows user to modify any of its properties with the indicator's properties dialog. For example, Moving Average has 7 calculating methods (Exponential, Simple, Time Series, Triangular, Variable, Volume Adjusted or Weighted) and 6 price quoting methods (open, high, low, close, median price or typical price).
Moreover, MetaStock® XIII added now indicators such as: The Dick Arms APC, The Jim Berg Volatility Entry System,The Justine Pollard-Smart Weekly Long System and Alan Hull Moving Average.

Expert Advisor provides you 20 default Expert Advisors formula in chart analysis. It allows beginners to set signal alerts, display trading signals and various chart styles such as different candlestick styles.
For Example: Equis – MACD, Equis – Relative Strength Index, Equis – Bollinger Bands, Equis – Stochastics etc.
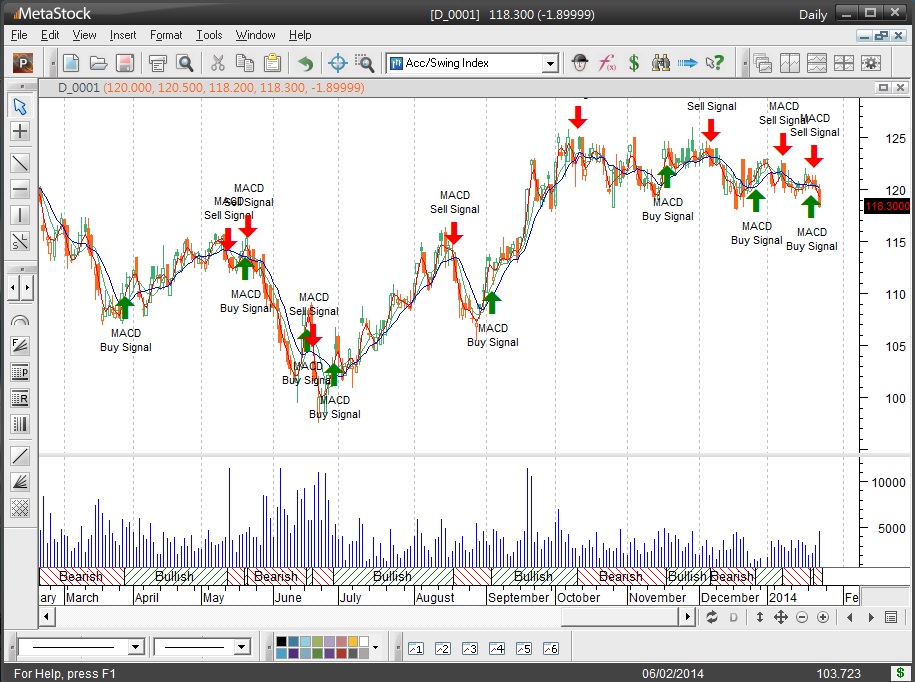
The Expert Advisor function in the chart is Equis – MACD. A clear trading signal position can be used to analyze and predict the trend.
Do simulated tradings on stock and futures by using different indicators. The function 'Optimization' allows you to amend the variables of indicators to conduct customized testing.
For example:
MACD's trading signal will arise when it crossed above or below the 9-day exponential moving average. Use 'Optimization' function to set 9-day exponential moving average as variable Opt1. The testing scope is set to default:5, Max:15 and adding 1 each time. Different reports and charts will be obtained by testing 10 different styles (MACD crosses above or below the 5, 6, 7 . . . 13, 14 and 15-day exponential moving average) to test which securities work well. It also save you time by testing multiple stocks simultaneously. simultaneously.

The chart shows the report of the best 5 performing securities of the testing. Opt1 variable used in the test was shown in the right bottom corner.
You can double-click the report result to show other subdivided analysis reports.


The Explorer searches through thousands of securities to instantly find out those that match the indicator signal.
For example:
To search securities with MACD buy signal. You could use the Equis – MACD buy signal formula to filter securities information. The Explorer searches thousands of securities to find those that match this description and display in list. Others will be put in the Reject page. You could then run The Explorer again to drill down further in this list and find securities that match specific criteria you are looking for.
The Explorer will allow you to make a copy of the report to any of Windows file editor such as Word、Excel、Notepad , etc for other purposes.


MetaStock® provides numbers of built in formulas and functions. If you would like to build MACD Histogram, you can simply make use of 'Indicator Builder' to add in a new indicator and name it "MACD Histogram", followed by adding a formula of "MACD() – MOV(MACD(), 9, E)".
Where:
- MACD( ) ---- to plot the MACD line
- MOV(MACD( ) ,9,E) ---- to plot the 9-day exponential moving average, signal line

MetaStock® gives flexibility in building your own formula and functions through Indicator Builder, Expert Advisor, System Tester and The Explorer. Default built in formula and function can also be used if building your own one is found to be difficult.
Price styles: Bars, Candlesticks, Candlevolume, Equivolume, Line, Kagi, Point & Figure, Renko, and Three Line Break.


As a trader, you know when analyzing a chart that the prices to the left of today's bar are pretty important. But what about tomorrow? That's were the money is. Imagine if you had a tool that could paint a more probable, easy-to-read picture of the future? A picture based on patent-pending technology that uses any or all of 67 event recognisers. A picture that helps you more precisely set profit targets and stops. That's what you get with the MetaStock® Forecaster, the latest PowerTool available exclusively in MetaStock® XIII and MetaStock® Pro XIII. Now your trading smarter. Now your trading with MetaStock®.

Top of Page
|
Please contact your account executive or call us now. Metastock Analysis Software & Scoreboard Data Service Tel : (852) 2277 6730 Fax : (852) 2277 6008 Email : scoreboard@phillip.com.hk Enquiry & Support Branches The Complaint Procedures |
About Us Phillip Securities Group Join Us Phillip Network Phillip Post Phillip Channel Latest Promotion |
E-Check Login |
Investor Notes Free Subscribe |

|
Contact Us
About Us
Phillip Securities Group
Join Us
Phillip Network
Phillip Post
Phillip Channel
Latest Promotion
Phillip Securities Group
Join Us
Phillip Network
Phillip Post
Phillip Channel
Latest Promotion
![]()
![]()
![]()
![]()